Building a design practice, without losing touch with the craft
My experience at Zencargo has been wide-reaching. From working in a design team of two, to leading a multidisciplinary team of thirteen. From detailed design execution, to collaborating with other leaders to shape our team structure. From product, to marketing, to HR.
One thing that has remained consistent is my passion for working cross-functionally to build products that serve real user needs.
Timeline: Joined 2020 → Corona virus outbreak → Suez Canal obstruction → Raised Series B → Fiercely competitive hiring market → SVB collapse → Market decline and redundancies → 2024
Attempting to distill 4 years gracefully
The following case study is a single project, amongst many, that showcases the ways of working and resources we created.
For context, post Series B, we (Software leadership) decided to enter into a process of replatforming – or 'reimagining' – to scale and meet evolving user needs. This technical challenge became another key consideration in product prioritisation.
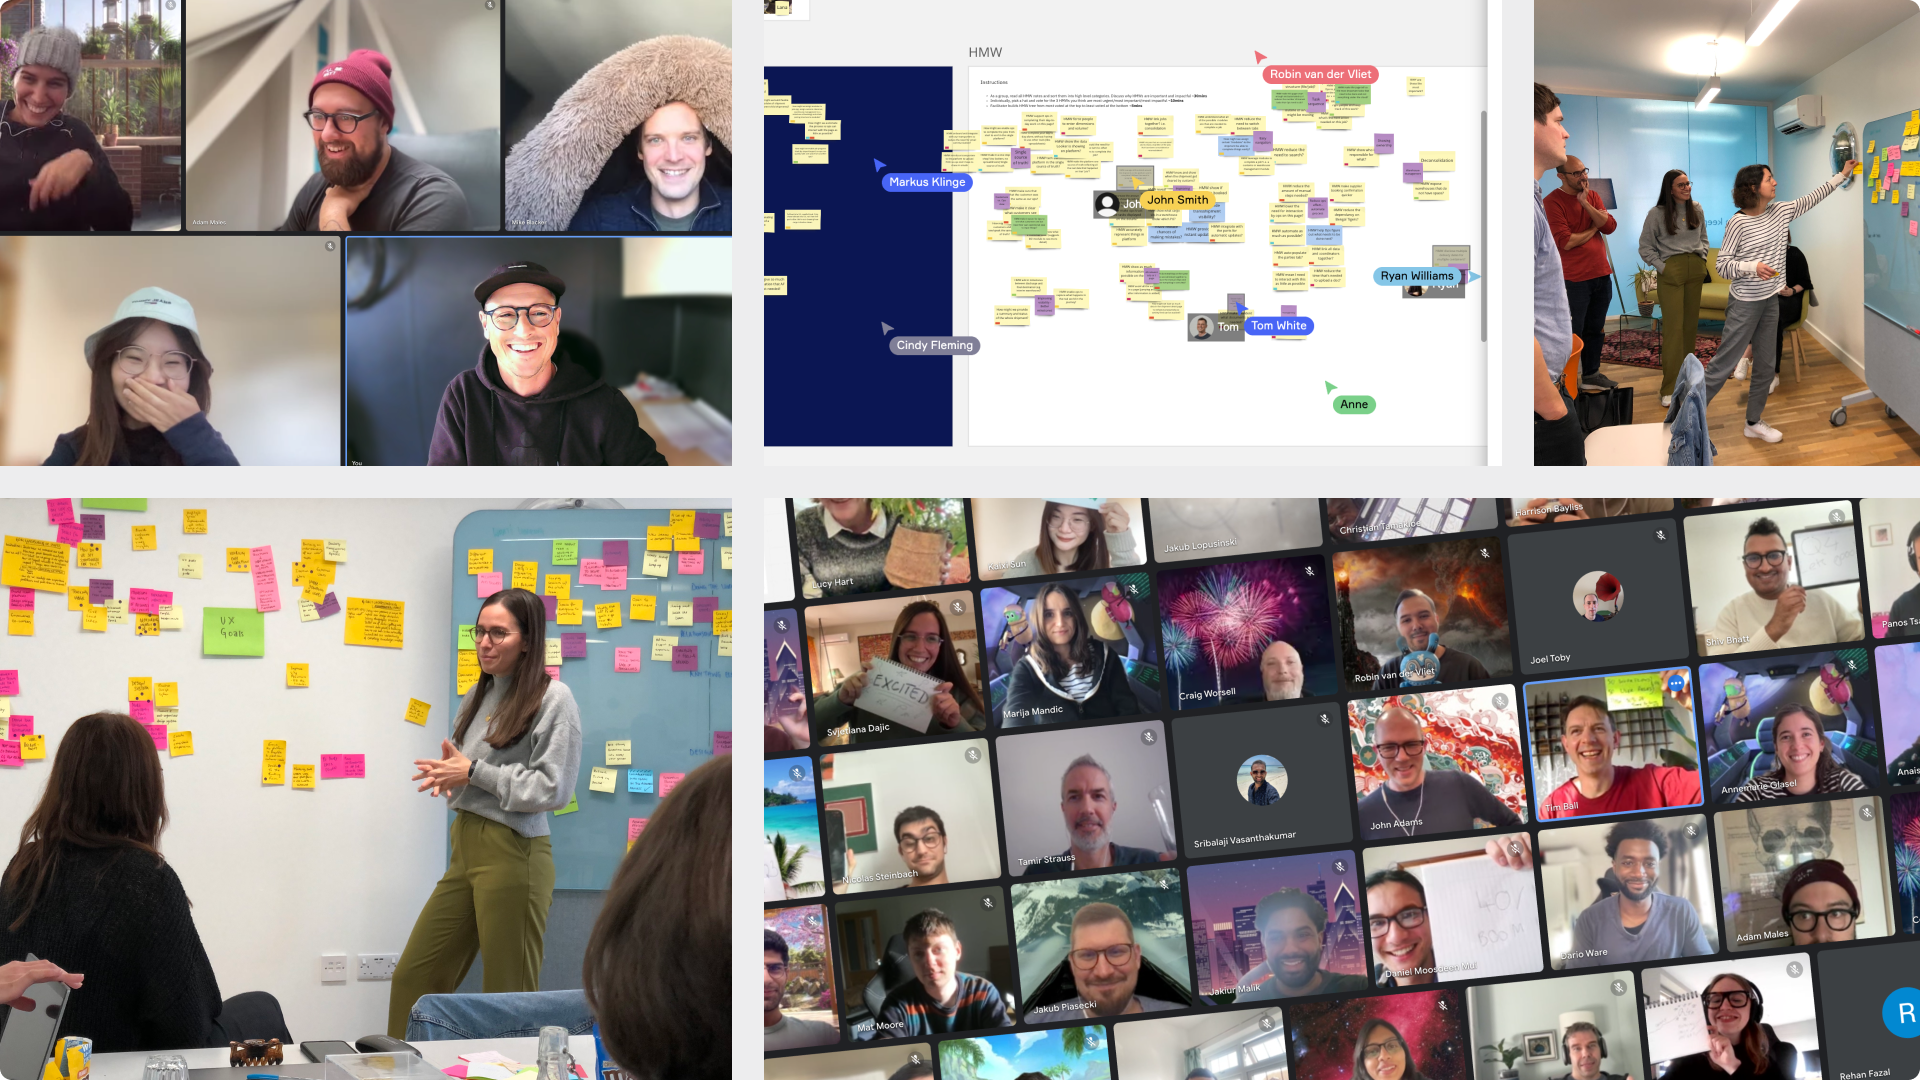
Live views and search
The most challenging aspect of replatforming was changing the engine mid-flight (keeping two systems running in parallel).
Our first project was to reimagine the data model for cargo movement, a key component of our supply chain digital twin goal. However, this project required the team to focus on individual cargo at first, meaning managing multiple cargo and shipments remained a challenge.
Work continued for the journey team and I joined a new team with the goal to build a central data repository (using Elasticsearch) which would allow us to centralise data from multiple sources, and enable us to rapidly create live views, dashboards and search. A game changer for the UX.
Accelerating the kick-off by leveraging existing research and data
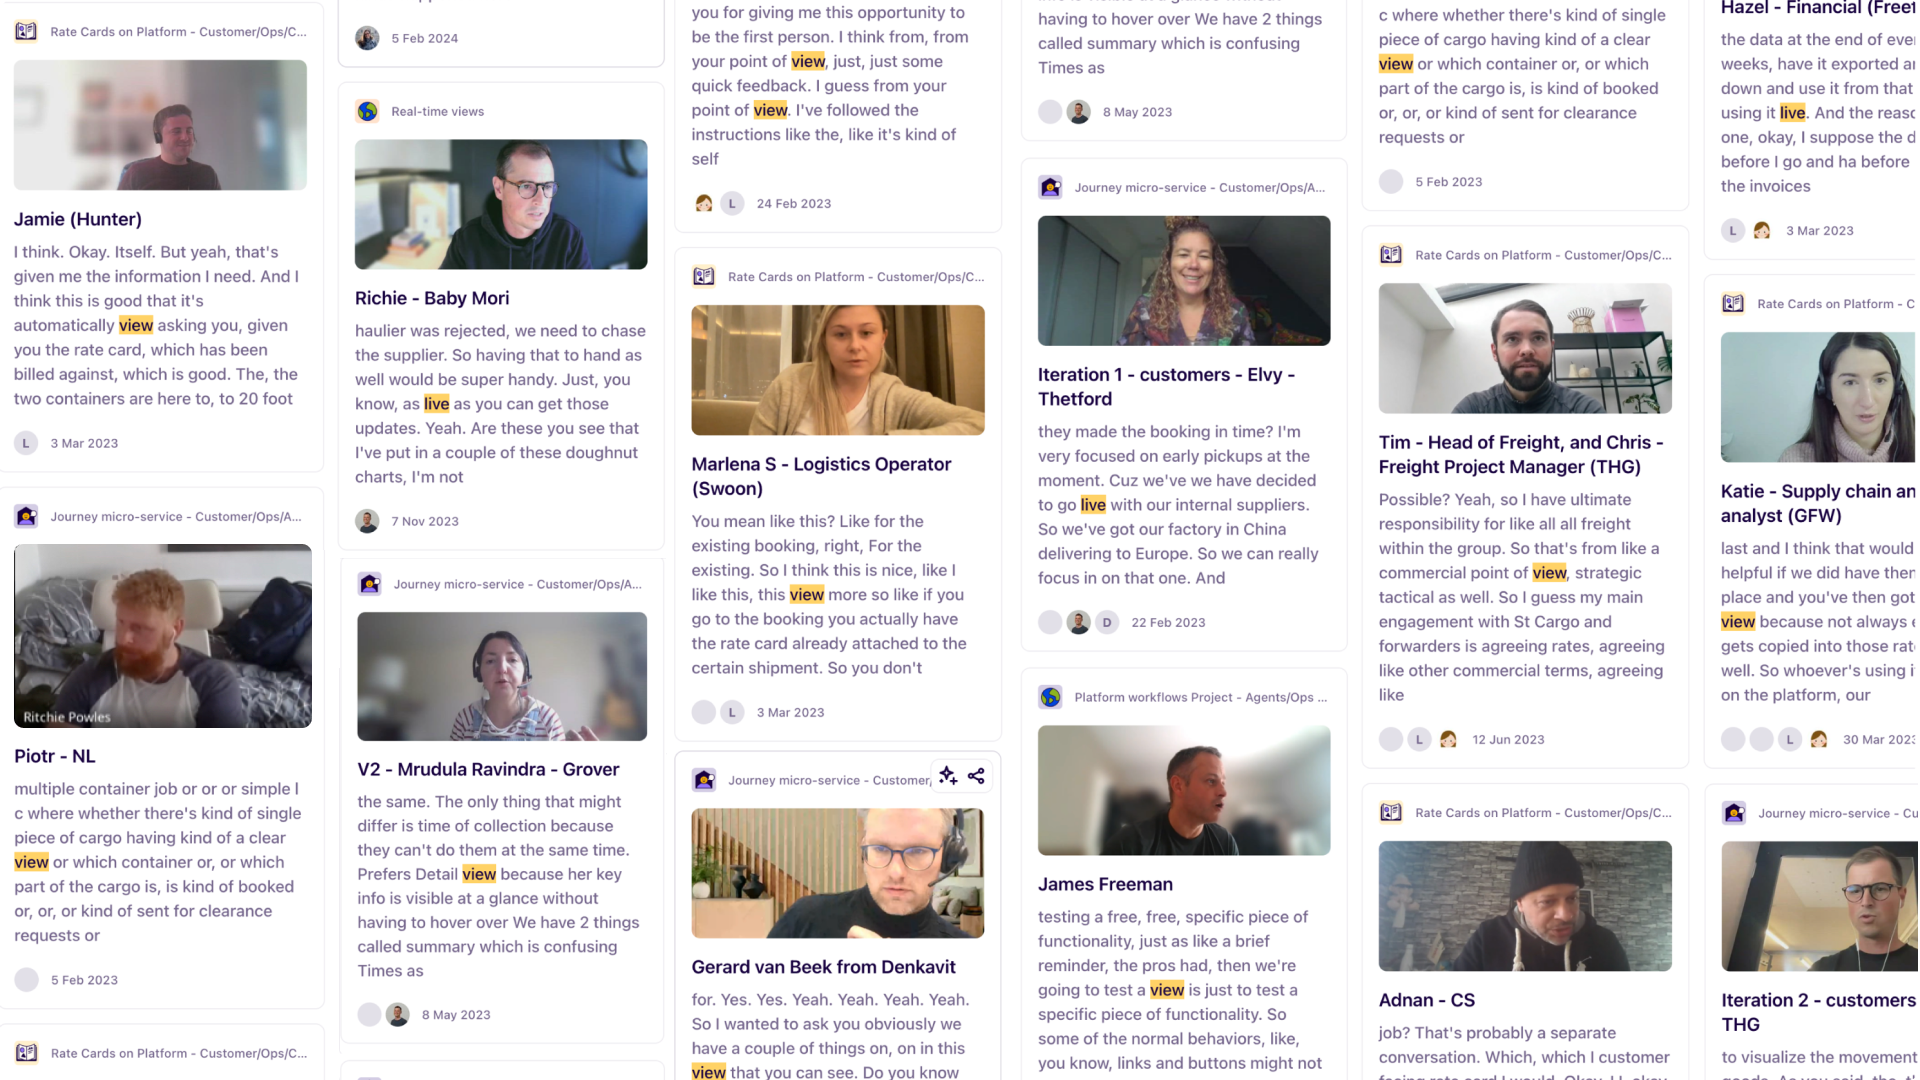
Over 4 years we had built a formidable research repository, rich with user insight. Whilst there's a risk in relying solely on past findings to inform your designs, it acts as a fantastic catalyst to inspire thinking and form hypotheses to interrogate.
One of Zencargo's offerings is analytics customised to the customer's specific needs. This meant that over the course of 4 years, hundreds of dashboards had been created and their usage was monitored. We took this data, mapped it against the end-to-end supply chain process and synthesised findings.
Together, the qualitative research and behavioural analysis gave us solid ideas about user needs – allowing us to side-step early insight gathering and jump straight to prototyping.
Using visuals to learn
Our initial prototypes were deliberately broad and focused less on execution and more on key concepts. They were designed in a way to help us interrogate user needs in our testing.
Dashboards weren't necessarily the highest priority for us, but they were the aspect of greatest unknown, and we felt the use cases uncovered would help stand us in good stead for all aspects of the project.
Normally I wouldn't move to high-fidelity so quickly, but our extensive design system made it the fastest route forward.
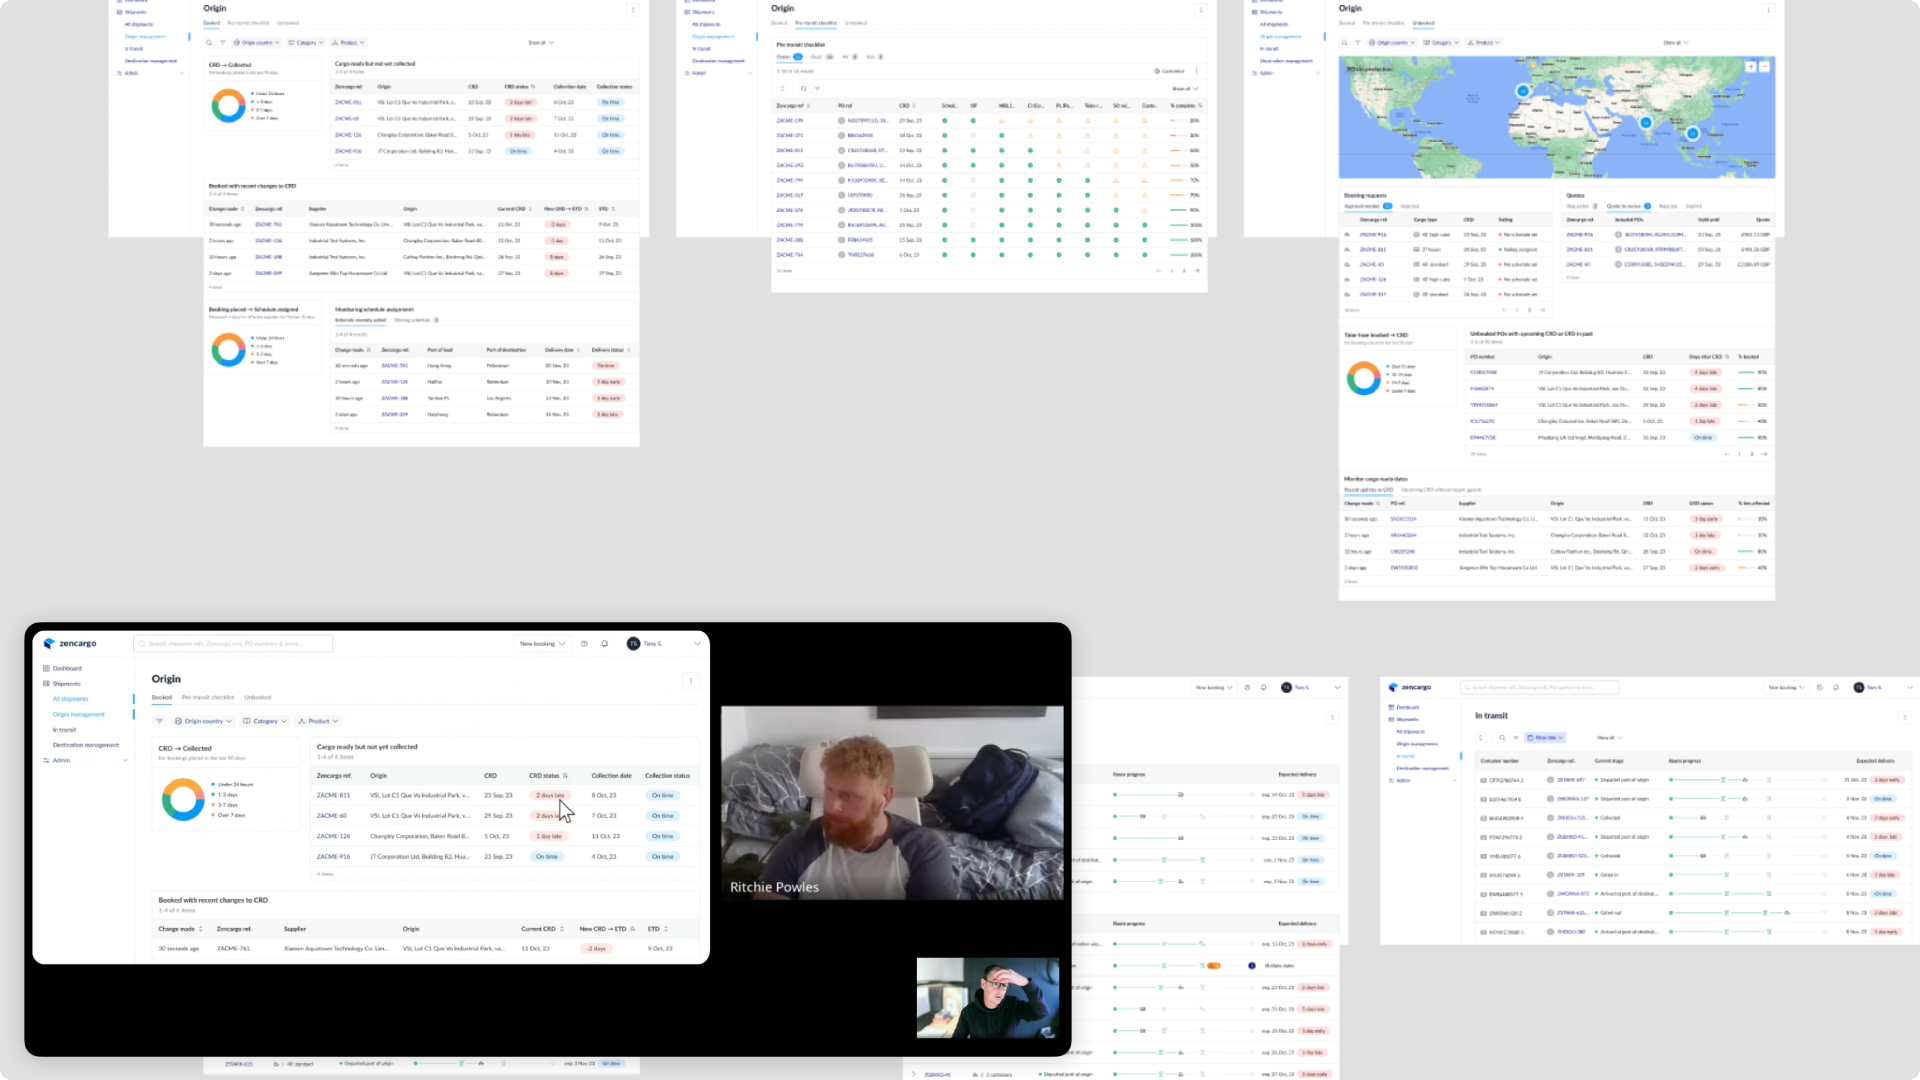
Deepening our understanding of user needs and use cases
We spoke with 6 customers that represented our customer base well. It surfaced detailed insight about needs (such as challenges with consolidation), as well as high-level insight to guide prioritisation – most notably that tables were of the highest priority to them.
Subsequent rounds of research would help with course correction and guide thinking.
The Outcomes
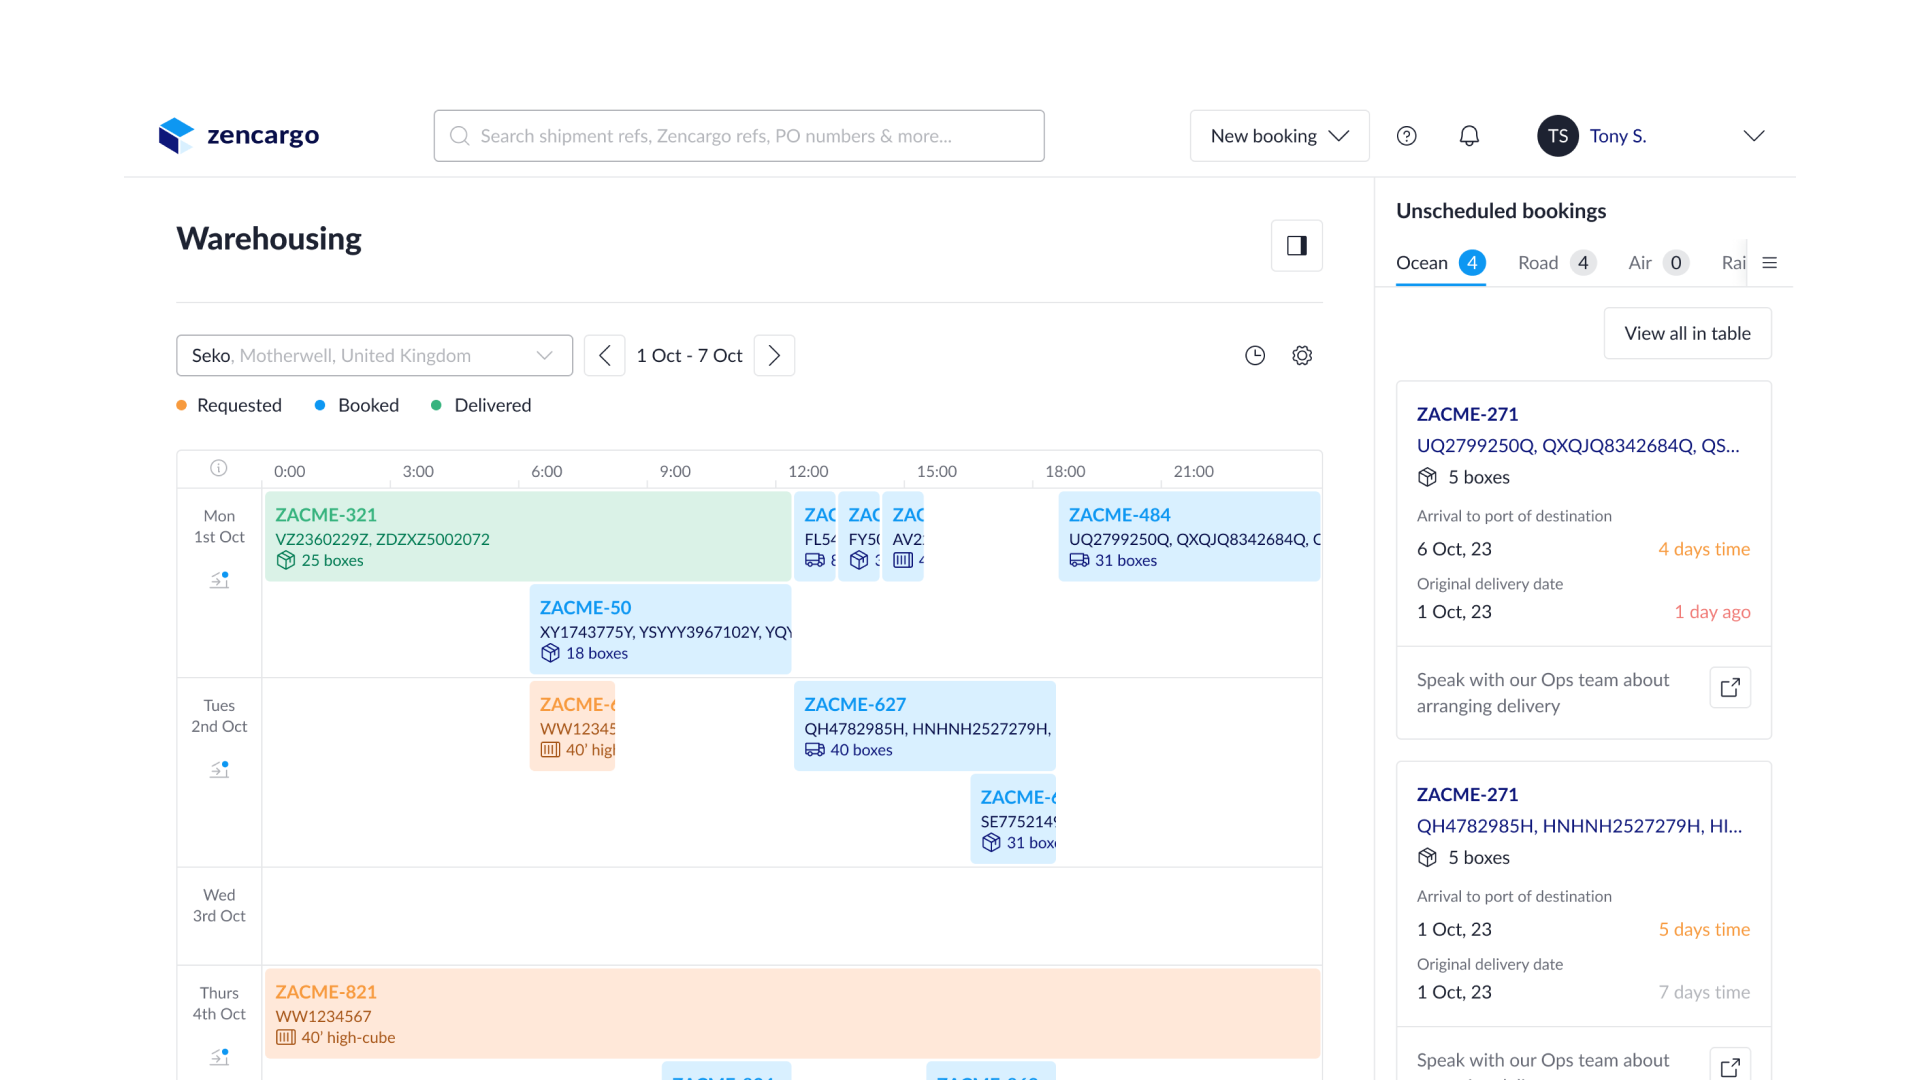
Destination management - A pragmatic business decision
The process of destination management was considered lacking in our offering, which was a high risk as tender season approached. In our regular stakeholder playback, we collectively agreed to prioritise a warehouse schedule tool.
Due to other high priorities, our goal was to keep this feature as lean as possible, delivering an MVP that we could iterate on in the future based on our post-launch analysis, and that would allow us to quickly progress to tables, where the core user value was.
Customised visibility
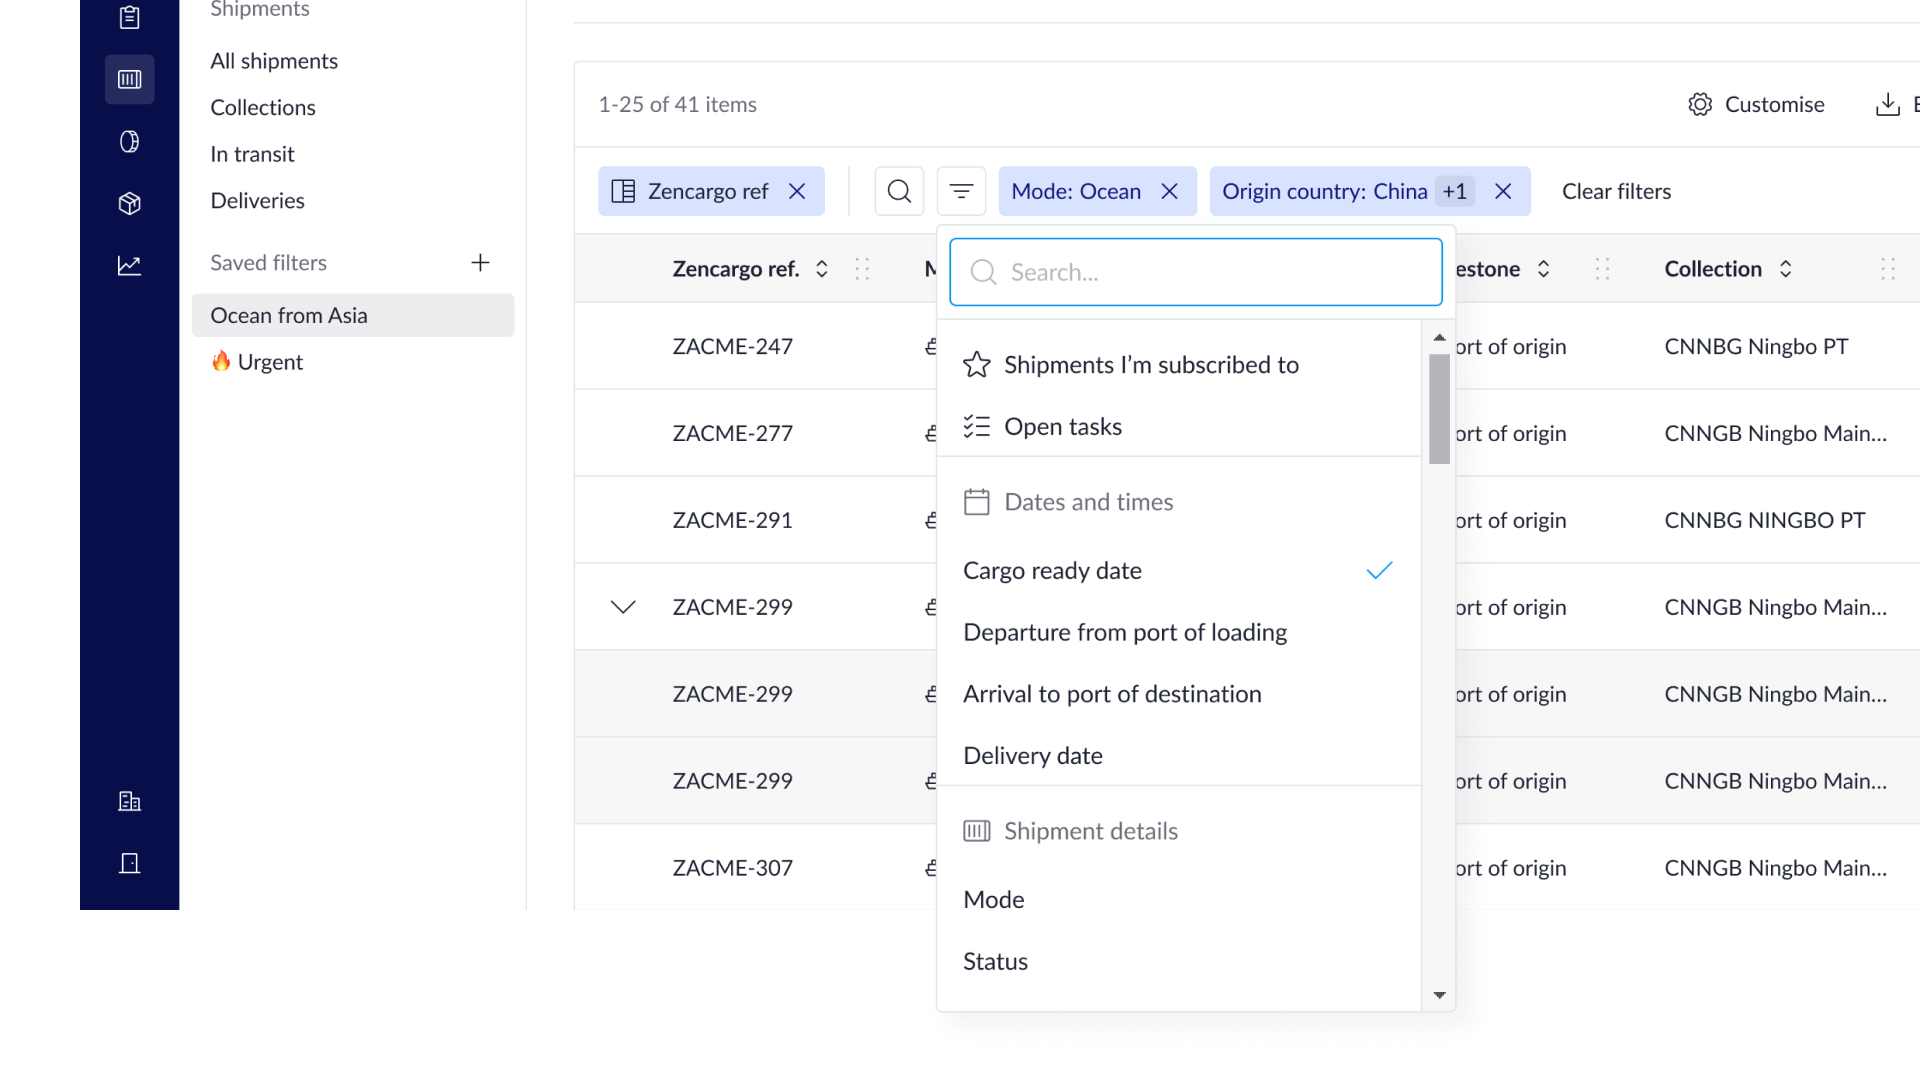
Despite not being the most glamorous of features, tables are crucial in allowing flexibility of visibility.
From our research, we had a good idea of where our current tables underperformed but also, through the design process, where opportunities lay.
Our initial focus was overhauling and enhancing filtering capabilities, and built a pattern that could be used for all filtering needs across the platform.
From there we introduced saved views, allowing users to quickly access and share important views. This inspired us to accelerate rethinking the navigation.
Advanced search
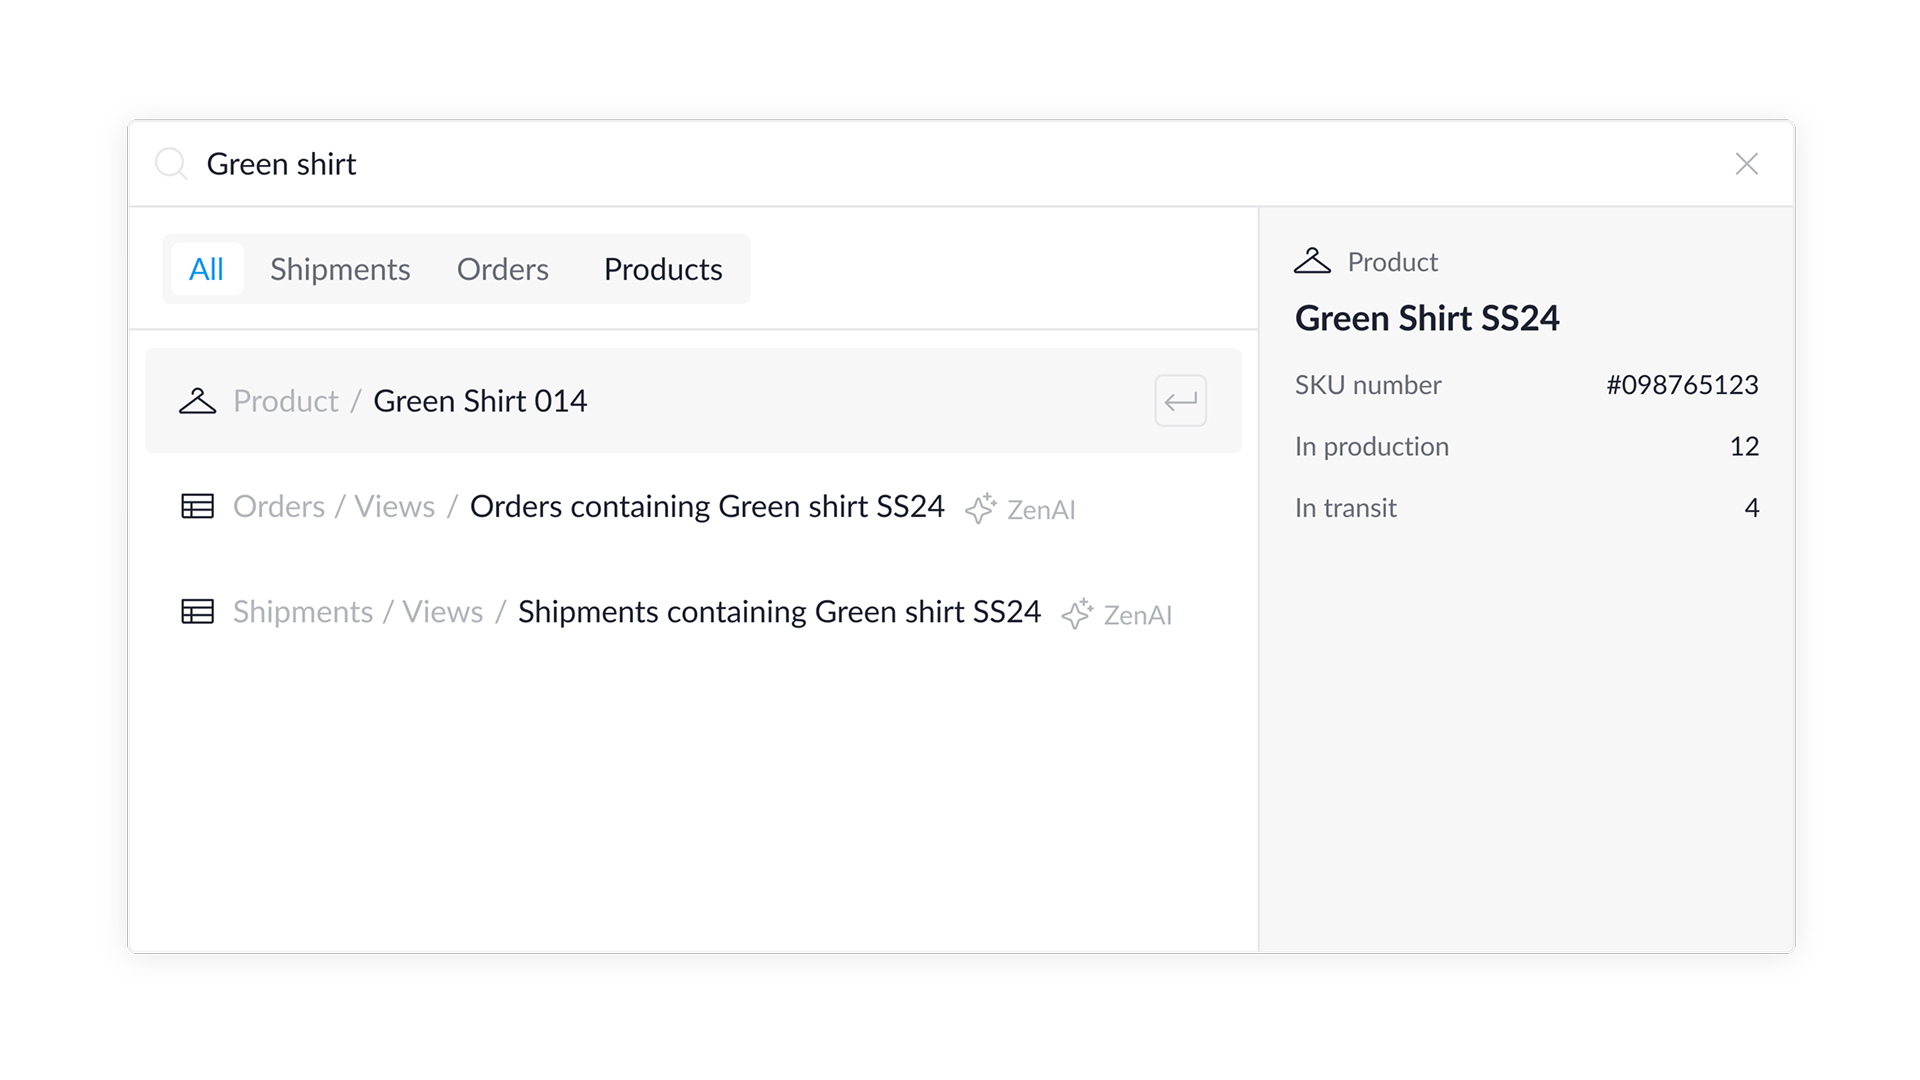
Global Search was the most common way of navigating. Considering the high usage, and with Elasticsearch under the hood, we saw an opportunity to turbo-charge the feature, bringing it closer to a command menu:
- Search everything – from pages to products, we'd index everything.
- Inline content – bringing contextual information into search would avoid the need to click through for one small piece of information.
- Utilising new tables – leveraging AI to generate live tabular views based on natural language search.
Outcomes
Warehouse schedule
- Increased warehouse roles on platform from 0.02% of accounts (3 total) to 15% of accounts
- Reduced demurrage costs from ~$650 per customer p/m to $100 per customer p/m
Tables
- Reduced no of monolith dependencies from 7 to 4
- Reduced time to surface data in live views from 3.5 seconds to 1.5 seconds
Achievements at Zencargo
- Built a design and research practice of 13 highly skilled individuals, from juniors to heads of.
- Led multiple cross-functional workshops focusing on organisational change, goal setting and product strategy.
- Worked with counterparts in Leadership to design the Software Org team shape and working processes through a phase of growth.
- Established a tooling strategy allowing design and research to flourish in the business and ultimately enhance the user experience.
- Developed a platform that our customers love, with a current CSAT score of 8/10.